In December 2020, amidst the controversy over value confirmation and bubble questioning, BTC, after experiencing a journey from $19,000 to $3,000, broke through a historical high and climbed to a new high of $20,000.
In January 2021, BTC surpassed its previous high by two times, after reaching $42,000, it pulled back to around $30,000.
In February 2021, BTC faced the unbelievable gaze of the world and once again broke through 42,000 U.S. dollars, 50,000 U.S. dollars, 55,000 U.S. dollars, 57,000 U.S. dollars…
On February 21, 2021, BTC was on its way to hit 58,000 U.S. dollars and fell to near 55,000 U.S. dollars when it encountered resistance.
The question is, is it a small correction? Or is BTC peaking, can such a high level of BTC be bought?
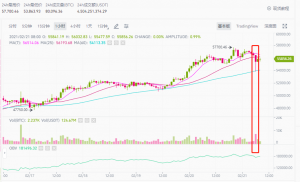
Trading volume is the most realistic indicator, and prices can be manipulated, but trading volume requires real money to participate. Every 1 dollar of trading volume means 1 dollar of liquidity. When it comes to trading volume, the most intuitive thing is to observe the K-line chart. This is the timeline chart of BTC. It can be seen that at 6 o’clock this morning, BTC fell the most, and at this time relatively higher trading volume was also generated.

Of course, strictly speaking, the K-line chart shows the transaction volume rather than the transaction volume, which is measured in currency. The price is falling, but the transaction volume has increased, indicating that relatively more funds are buying BTC. As a result, the decline of BTC is hindered. When it fell, there was still a lot of money to buy BTC, which reflected the market’s expectations of confidence in BTC.
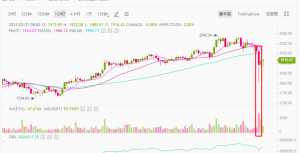
Let’s take a look at some other mainstream coins, this is ETH:

Several mainstream currencies also produced larger transactions when they fell. It shows that investors still have confidence in the currency market. In fact, novice leeks often show FOMO psychology at high positions, and old leeks often like to wait for phased corrections and wait for opportunities to buy into the car.
This is why William does not recommend small retail investors to buy BTC. It is not that he is not optimistic about BTC, but just buys BTC at a higher point. Some small customers, especially small customers who are new to cryptocurrency, always have a bad mentality. The result may be that they did not make money. Lose more funds.
Trading volume-to-market value ratio, using daily trading volume divided by market value, can reflect trading frequency. This indicator, first of all, can eliminate the impact of price fluctuations on trading volume. After all, the price of BTC fluctuates every day.
First, the impact of price levels can be eliminated. On different dates, because BTC is not at the same price level at all, the so-called transaction volume (in fact, the transaction amount) does not truly reflect the transaction volume of BTC.
Second, the impact of additional issuance of BTC can be eliminated. After all, there will be a certain amount of new BTC output every day. Currently, about 900 new BTCs are produced every day.

In March 2020, the price of BTC dropped and the frequency of transactions surged, reflecting market panic. On the one hand, a large amount of BTC was sold, and on the other hand, a large amount of BTC was bought.
In September 2020, BTC once hit 12,000 US dollars, and instantly stood above 12,000 US dollars and dropped sharply. At that time, Defi coins such as SUSHI rose wildly, while mainstream coins such as BTC performed relatively flat. At that time, the trading volume also rose, and there was also market panic, with a lot of selling and buying.
In January 2021, BT had a callback, and there was also a relative increase in transaction frequency here. However, this transaction frequency is still very low compared to the previous two. So soon, BTC continued its upward trend after half a month of correction.
In fact, in December 2017, BTC also had a similar pattern. However, observing the BTC at this stage, there is no obvious increase in transaction frequency at all. Instead, the transaction frequency has been declining in recent days. However, the price of BTC has been rising these days. This shows that the power to buy is more dominant, while the power to sell is not much. Holders of BTC still have higher expectations.
The enlightenment of gold to BTC is:
First, in the environment of great inflation, the reason why gold rose first and then fell is because the price of gold would have risen under inflation, but this affected expectations and accelerated and increased the rise of gold, which led to the formation of an expectation bubble and the emergence of a bubble. A certain degree of decline.
Second, gold rose for 5 months, while BTC only rose for 4 months.
Third, BTC is different from gold. The rise in gold is more due to inflation and market expectations of inflation. There are two fundamental reasons for the rise of BTC, one is inflation, the other is the consensus of the BTC 4-year cycle, and the BTC consensus bull market in 2021. Of course, above these two factors, there will be bigger bubbles respectively.
Therefore, BTC should not reach the top yet.


